1 回答
TA贡献1799条经验 获得超8个赞
这是我的解决方案:
# Import packages
import numpy as np
from mpl_toolkits.mplot3d import Axes3D # Needed to create 3D plots
import matplotlib
import matplotlib.pyplot as plt
#%matplotlib notebook # Uncomment this if using Jupyter
# Define function
def fun(x):
# Note: x is a complex() object, and * and + are defined for complex numbers
return x*x + 1
# Create 1x1 figure with 3 axes
fig = plt.figure()
ax = fig.add_subplot(111, projection='3d')
# Define grid of x and w using a step of 0.05
X = W = np.arange(-20.0, 20.0, 0.05)
X, W = np.meshgrid(X,W)
complexVals = X + 1j*W # Convert X/W grid into complex numbers
# Call the function on the complex numbers and extract the real/imag parts
Y_Z = fun(complexVals)
Y = Y_Z.real
Z = Y_Z.imag
# Create colormap for W
color_dimension = W
minn, maxx = color_dimension.min(), color_dimension.max()
norm = matplotlib.colors.Normalize(minn, maxx)
m = plt.cm.ScalarMappable(norm=norm, cmap='jet')
m.set_array([])
fcolors = m.to_rgba(color_dimension)
# Create surface
ax.plot_surface(X, Y, Z, facecolors=fcolors, vmin=minn, vmax=maxx, shade=False,
linewidth=0, antialiased=False)
# Set axis labels
ax.set_xlabel('X (Re)')
ax.set_ylabel('Y (Re)')
ax.set_zlabel('Z = f(x) (Im)')
# Create colorbar and set title
cbr = plt.colorbar(m)
cbr.ax.set_title('W')
# Show plot with colorbar
plt.show()
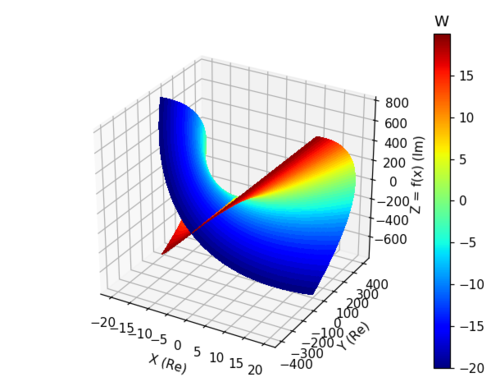
这是输出:

但是,如果您使用 Anaconda,我强烈建议将此代码添加到 Jupyter Notebook 中。这就是你可以获得交互式情节的原因。
它已经随 Anaconda 一起安装,您可以通过jupyter notebook在 Anaconda 提示符中输入来启动它。
添加回答
举报
