1 回答
TA贡献1921条经验 获得超9个赞
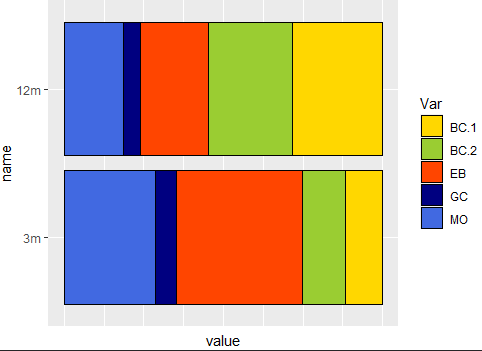
也许可以尝试使用以下方法ggplot2和tidyverse函数:
library(tidyverse)
#Code
test.matrix %>% as.data.frame.matrix %>% rownames_to_column('Var') %>%
pivot_longer(-Var) %>%
mutate(name=factor(name,levels = rev(unique(name)),ordered = T)) %>%
ggplot(aes(x=name,y=value,fill=Var))+
geom_bar(stat='identity',color='black',position='fill')+
coord_flip()+
scale_fill_manual(values=c('BC.1'="gold",'BC.2'="yellowgreen",
'GC'="navy",'MO'="royalblue",'EB'="orangered"))+
theme(axis.text.x = element_blank(),
axis.ticks.x = element_blank())
输出:

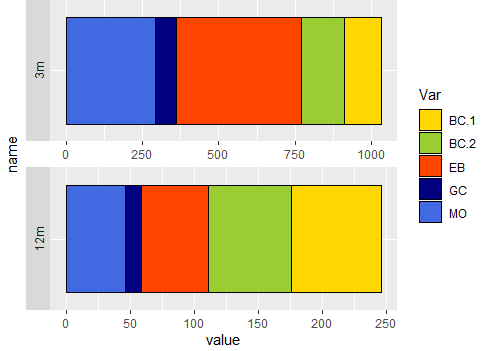
另一种选择可以是:
#Code 2
test.matrix %>% as.data.frame.matrix %>% rownames_to_column('Var') %>%
pivot_longer(-Var) %>%
mutate(name=factor(name,levels = rev(unique(name)),ordered = T)) %>%
ggplot(aes(x=name,y=value,fill=Var))+
geom_bar(stat='identity',color='black')+
coord_flip()+
facet_wrap(name~.,scales = 'free',strip.position = 'left',ncol = 1)+
scale_fill_manual(values=c('BC.1'="gold",'BC.2'="yellowgreen",
'GC'="navy",'MO'="royalblue",'EB'="orangered"))+
theme(axis.text.y = element_blank(),
axis.ticks.y = element_blank())
输出:

添加回答
举报
