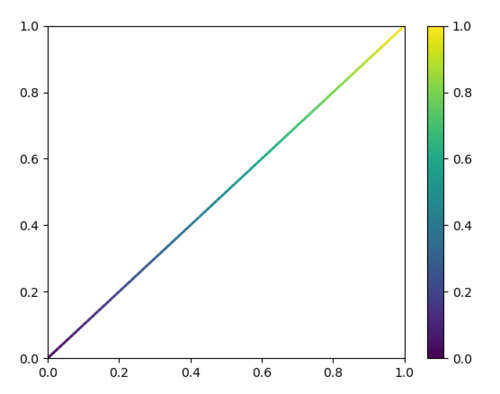
此代码绘制scatterplot带有渐变颜色的 a:import matplotlib.pyplot as pltimport numpy as npx = np.arange(30)y = xt = xplt.scatter(x, y, c=t)plt.colorbar()plt.show()但是我如何line用x和y坐标绘制渐变颜色?
1 回答
红颜莎娜
TA贡献1842条经验 获得超12个赞
一个最小的工作示例可以是
import numpy as np
import matplotlib.pyplot as plt
from matplotlib.collections import LineCollection
x = np.linspace(0,1, 100)
y = np.linspace(0,1, 100)
cols = np.linspace(0,1,len(x))
points = np.array([x, y]).T.reshape(-1, 1, 2)
segments = np.concatenate([points[:-1], points[1:]], axis=1)
fig, ax = plt.subplots()
lc = LineCollection(segments, cmap='viridis')
lc.set_array(cols)
lc.set_linewidth(2)
line = ax.add_collection(lc)
fig.colorbar(line,ax=ax)

添加回答
举报
0/150
提交
取消
