我对 matplotlib.pyplot.bar 有问题,其中条形只能具有恒定的宽度,但我想绘制一个图,其中条形位于两点之间。正如我们在图中看到的,点有不同的距离,我想用条形填充所有的间隙。抱歉,如果之前有人问过这个问题,我找不到它。i所以基本上我想把和之间的距离宽度作为点的条形i+1,如果这有意义的话。
1 回答
牧羊人nacy
TA贡献1862条经验 获得超7个赞
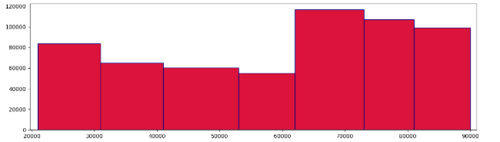
以下示例创建一个具有 7 个高度值和 8 个边界的条形图。连续边界之间的差值用作条宽度。条形默认与其中心对齐,但在处理宽度不均匀时,align='edge'则需要对齐。
from matplotlib import pyplot as plt
import numpy as np
bounds = np.array([21000, 31000, 41000, 53000, 62000, 73000, 81000, 90000])
heights = np.random.randint(50000, 120000, len(bounds) - 1)
plt.bar(bounds[:-1], heights, width=np.diff(bounds), align='edge', color='crimson', ec='navy')
# plt.xticks(bounds) # to have the boundaries as x ticks
plt.show()
添加回答
举报
0/150
提交
取消