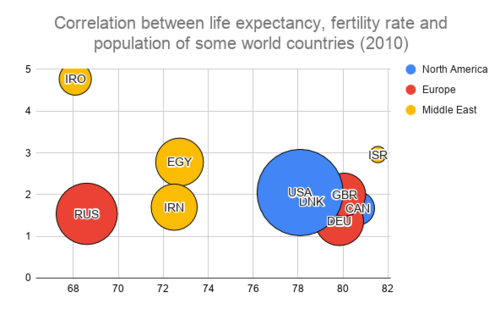
我使用 Google 示例https://developers.google.com/chart/interactive/docs/gallery/bubblechart来使用 Python v3.7.8 测试 Google Spreadshhet API v4 以创建气泡图。数据存储在 Google Drive 的电子表格中,我在其中创建气泡图。气泡图已创建,但气泡不可见/不显示。下面的代码:from googleapiclient.discovery import buildfrom google_auth_oauthlib.flow import InstalledAppFlowfrom google.auth.transport.requests import Request...body = {'requests': [{'addChart': {'chart': {'spec': {'title': 'Correlation between life expectancy, fertility rate and population of some world countries (2010)', 'titleTextPosition': {'horizontalAlignment': 'CENTER'}, 'bubbleChart': {'legendPosition': 'RIGHT_LEGEND', 'domain': {'sourceRange': {'sources': [{'sheetId': 909072886, 'startRowIndex': 17, 'endRowIndex': 27, 'startColumnIndex': 1, 'endColumnIndex': 2}]}}, 'series': {'sourceRange': {'sources': [{'sheetId': 909072886, 'startRowIndex': 17, 'endRowIndex': 27, 'startColumnIndex': 2, 'endColumnIndex': 3}]}}, 'groupIds': {'sourceRange': {'sources': [{'sheetId': 909072886, 'startRowIndex': 17, 'endRowIndex': 27, 'startColumnIndex': 3, 'endColumnIndex': 4}]}}, 'bubbleLabels': } } } } } ] }response = service.spreadsheets().batchUpdate(spreadsheetId=file_id, body=body).execute()我应该得到以下信息:但我明白了:没有显示气泡。备注:将鼠标悬停在(不可见)气泡上,它会显示该国所有正确的数据(预期寿命、生育率、人口、正确颜色的地区)!
1 回答
当年话下
TA贡献1890条经验 获得超9个赞
在这种情况下,我建议将bubbleMaxRadiusSize和包含bubbleMinRadiusSize在请求正文中,如下所示。当你的请求体被修改后,就变成了下面这样。
从:
'bubbleOpacity': 1.0}},
到:
'bubbleOpacity': 1.0,
'bubbleMaxRadiusSize': 50,
'bubbleMinRadiusSize': 5
}},
在此修改中,50和分别5用作 和 的样本bubbleMaxRadiusSize值bubbleMinRadiusSize。所以请根据您的实际情况修改这些值。
结果:
整个脚本:
body = {'requests': [{'addChart': {'chart': {'spec': {'title': 'Correlation between life expectancy, fertility rate and population of some world countries (2010)', 'titleTextPosition': {'horizontalAlignment': 'CENTER'},
'bubbleChart': {
'legendPosition': 'RIGHT_LEGEND',
'domain': {'sourceRange': {'sources': [{
'sheetId': 909072886,
'startRowIndex': 17,
'endRowIndex': 27,
'startColumnIndex': 1,
'endColumnIndex': 2,
}]}},
'series': {'sourceRange': {'sources': [{
'sheetId': 909072886,
'startRowIndex': 17,
'endRowIndex': 27,
'startColumnIndex': 2,
'endColumnIndex': 3,
}]}},
'groupIds': {'sourceRange': {'sources': [{
'sheetId': 909072886,
'startRowIndex': 17,
'endRowIndex': 27,
'startColumnIndex': 3,
'endColumnIndex': 4,
}]}},
'bubbleLabels': {'sourceRange': {'sources': [{
'sheetId': 909072886,
'startRowIndex': 17,
'endRowIndex': 27,
'startColumnIndex': 0,
'endColumnIndex': 1,
}]}},
'bubbleSizes': {'sourceRange': {'sources': [{
'sheetId': 909072886,
'startRowIndex': 17,
'endRowIndex': 27,
'startColumnIndex': 4,
'endColumnIndex': 5,
}]}},
'bubbleOpacity': 1.0,
'bubbleMaxRadiusSize': 50, # Added
'bubbleMinRadiusSize': 5, # Added
}}, 'position': {'overlayPosition': {
'anchorCell': {'sheetId': 909072886, 'rowIndex': 61, 'columnIndex': 6},
'offsetXPixels': 0,
'offsetYPixels': 0,
'widthPixels': 600,
'heightPixels': 371,
}}}}}]}
response = service.spreadsheets().batchUpdate(spreadsheetId=file_id, body=body).execute()
添加回答
举报
0/150
提交
取消