1 回答
TA贡献1982条经验 获得超2个赞
查看内嵌评论
pandas.to_datetime.dt存取器pandas.Series.dt.yearpandas.Series.dt.month
pandas.DataFrame.groupby聚合
pandas.DataFrame.plot.barh
import pandas as pd
import matplotlib.pyplot as plt
# setup dataframe
data = {'Month&Year': ['2016-11', '2016-11', '2016-06', '2015-10', '2015-10', '2014-01', '2017-02', '2017-02', '2017-02', '2017-05'],
'Monthly Revenue': [261.96, 731.94, 14.62, 957.5775, 22.368, 25.248, 91.96, 258.576, 29.6, 243.16]}
df = pd.DataFrame(data)
# convert the Month&Year column to a datetime column
df['Month&Year'] = pd.to_datetime(df['Month&Year'], format='%Y-%m')
# use the .dt accessor to groupby year and month and sum Monthly Revenue
dfg = df.groupby([df['Month&Year'].dt.year, df['Month&Year'].dt.month]).agg({'Monthly Revenue': sum})
# rename the index columns
dfg.index = dfg.index.set_names(['year', 'month'])
# display(dfg)
Monthly Revenue
year month
2014 1 25.2480
2015 10 979.9455
2016 6 14.6200
11 993.9000
2017 2 380.1360
5 243.1600
# plot
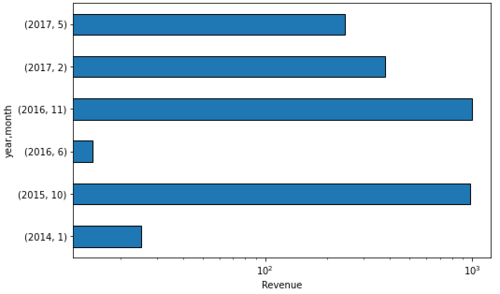
dfg.plot.barh(figsize=(8, 5), legend=False)
plt.xlabel('Revenue')
plt.xscale('log')
plt.show()

或者
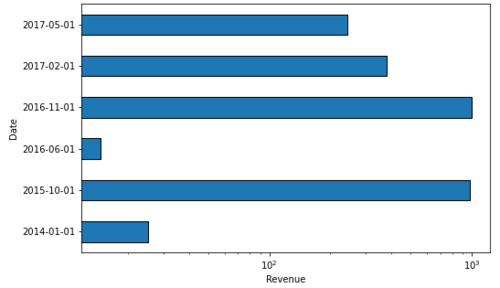
不是按yearand分组month,而是 groupby date。
# groupby
dfg = df.groupby(df['Month&Year'].dt.date).agg({'Monthly Revenue': sum})
# plot
dfg.plot.barh(figsize=(8, 5), legend=False)
plt.xlabel('Revenue')
plt.ylabel('Date')
plt.xscale('log')
plt.show()

添加回答
举报
