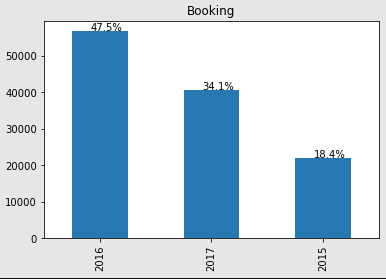
我试图显示每列的百分比并遇到错误 - IndexError: index 3 is out ofbounds for axis 0 with size 3import pandas as pdimport numpy as np import matplotlib.pyplot as plt% matplotlib inline import seaborn as snsdf = pd.read_csv('https://github.com/Kevin-ck1/Intro-To-Data-Science/raw/master/hotel_bookings.csv')df_booking = df.copy()df_booking['percentage'] = round(df_booking['arrival_date_year']/df_booking['arrival_date_year'].sum() * 100, 1)df_booking['arrival_date_year'].value_counts(dropna=True).plot(kind="bar")xlocs, xlabs = plt.xticks()for i, v in enumerate(df_booking['percentage']): plt.text(xlocs[i] - 0.08, v + 25, str(v) + '%', fontsize = 15)plt.title('Booking')plt.show()给出的错误信息是IndexError Traceback (most recent call last)<ipython-input-59-07b4659a45f8> in <module>() 21 for i, v in enumerate(df_booking['percentage']): 22 ---> 23 plt.text(xlocs[i] - 0.08, v + 25, str(v) + '%', fontsize = 15) 24 25 plt.title('Booking')IndexError: index 3 is out of bounds for axis 0 with size 3
1 回答
狐的传说
TA贡献1804条经验 获得超3个赞
使用当前代码,存储计数是有意义的,然后计算百分比,然后使用百分比添加刻度:
counts = df['arrival_date_year'].value_counts(dropna=True)
perc = round(100*counts/counts.sum(),1).to_numpy()
counts.plot(kind="bar")
xlocs, xlabs = plt.xticks()
for i in range(len(da)):
plt.text(xlocs[i] - 0.08, counts.iloc[i] + 25, str(perc[i]) + '%', fontsize = 10)
plt.title('Booking')
plt.show()

添加回答
举报
0/150
提交
取消
