1 回答
TA贡献1852条经验 获得超7个赞
https://codesandbox.io/s/stackoverflow-64928268-fetch-12fxi?file=/src/index.js
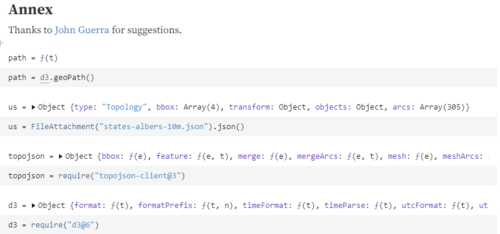
首先,您需要导入该页面底部的模块/文件

不要忘记此存储库中的 JSON 数据:https://github.com/topojson/us-atlas
为此,我建议使用 npm 以及 Parcel 或 Webpack 构建页面。为此,您可以package.json在新目录中创建该文件。确保你的机器上安装了nodejs和npm,然后:
从控制台类型
npm install然后键入
npm run start在本地运行。或者
npm run build将应用程序打包上传到网上
./package.json
{
"name": "vanilla",
"version": "1.0.0",
"description": "StackOverflow",
"main": "index.html",
"scripts": {
"start": "parcel index.html --open",
"build": "parcel build index.html"
},
"dependencies": {
"d3": "6.2.0",
"path": "0.12.7",
"topojson-client": "3.1.0"
},
"devDependencies": {
"@babel/core": "7.2.0",
"parcel-bundler": "^1.6.1"
},
"keywords": [
"javascript",
"starter"
]
}
./index.html
<!DOCTYPE html>
<html>
<head>
<title>Stack Overflow</title>
<meta charset="UTF-8" />
</head>
<body>
<script src="src/index.js"></script>
</body>
</html>
然后我发现将图表定义为函数很有用。
./src/index.js
const topojson = require("topojson-client");
const d3 = require("d3");
const path = d3.geoPath();
const getMapData = async () => {
const response = await fetch(
"https://cdn.jsdelivr.net/npm/us-atlas@3/states-albers-10m.json"
).then((response) => response.json());
return response;
};
const buildAndDisplayChart = async (domElement) => {
const width = 975;
const height = 610;
const us = await getMapData()
const zoom = d3.zoom().scaleExtent([1, 8]).on("zoom", zoomed);
const svg = d3
.create("svg")
.attr("viewBox", [0, 0, width, height])
.on("click", reset);
const g = svg.append("g");
const states = g
.append("g")
.attr("fill", "#444")
.attr("cursor", "pointer")
.selectAll("path")
.data(topojson.feature(us, us.objects.states).features)
.join("path")
.on("click", clicked)
.attr("d", path);
states.append("title").text((d) => d.properties.name);
g.append("path")
.attr("fill", "none")
.attr("stroke", "white")
.attr("stroke-linejoin", "round")
.attr("d", path(topojson.mesh(us, us.objects.states, (a, b) => a !== b)));
svg.call(zoom);
function reset() {
states.transition().style("fill", null);
svg
.transition()
.duration(750)
.call(
zoom.transform,
d3.zoomIdentity,
d3.zoomTransform(svg.node()).invert([width / 2, height / 2])
);
}
function clicked(event, d) {
const [[x0, y0], [x1, y1]] = path.bounds(d);
event.stopPropagation();
states.transition().style("fill", null);
d3.select(this).transition().style("fill", "red");
svg
.transition()
.duration(750)
.call(
zoom.transform,
d3.zoomIdentity
.translate(width / 2, height / 2)
.scale(
Math.min(8, 0.9 / Math.max((x1 - x0) / width, (y1 - y0) / height))
)
.translate(-(x0 + x1) / 2, -(y0 + y1) / 2),
d3.pointer(event, svg.node())
);
}
function zoomed(event) {
const { transform } = event;
g.attr("transform", transform);
g.attr("stroke-width", 1 / transform.k);
}
document.querySelector(domElement).appendChild(svg.node())
};
buildAndDisplayChart("body")
该函数将生成一个 SVG,然后您可以将其附加到您选择的 DOM 元素中。
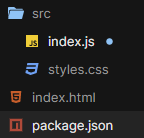
您的最终目录列表应如下所示:

添加回答
举报
