我在这方面有点挣扎 - 为了找到必要的电池容量,我需要分析一年的生产/需求数据。为此,我认为需要计算 0 线下方的最大面积。我想我需要找到该区域的起点/终点并将所有内容乘以其各自的 y 值?这是我的图表的简化版本:这是图像中 0 下方的最大区域,但在完整数据集中它可以是任何区域。我知道如何在找到相关区域边界的情况下将其集成,但我正在努力寻找一种有效的方法来做到这一点。我的数据框如下所示: demand Production diffTime2019-01-01 00:15:01 17.25 32.907 15.6572019-01-01 00:30:01 17.80 32.954 15.154... ... ... ...2019-01-16 22:15:02 17.34 27.704 10.3642019-01-16 22:30:01 18.67 35.494 16.824我使用此代码片段来查找最长区域的时间步长,但我缺少是否有办法将点乘以它们的 y 值(差异)。然而,从技术上讲,这是不正确的,考虑到一个区域可能长而窄,而另一个区域可能又短又高,因此整体区域更大。def max0(sr): return (sr >= 0).cumsum().value_counts().max() - (0 if (sr >= 0).cumsum().value_counts().idxmax() < 0 else 1)
1 回答
aluckdog
TA贡献1847条经验 获得超7个赞
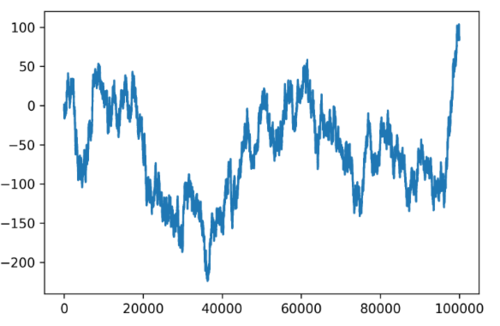
您可以找到 0 线下方的最大面积。我生成了自己的数据
x = np.random.randn(100000)
x = x.cumsum()-x.mean()
plt.plot(x);
现在计算正序列和负序列的起点和终点。序列中的每个值都会获得一个递增的整数,以便能够按序列进行分组。
x1 = np.diff(x < 0).cumsum()
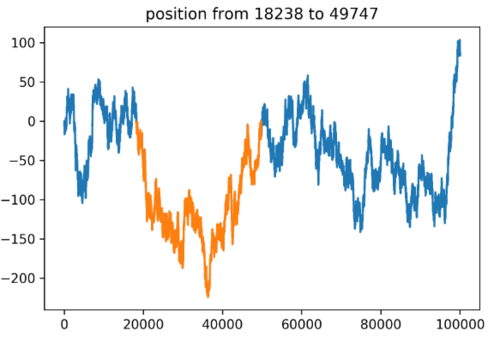
使用 pandas groupby 计算所有区域并找到最大的负数
df = pd.DataFrame({
'value': x[1:],
'border': x1
})
dfg = df.groupby('border')
mingr = dfg.apply(lambda x: np.trapz(x.value)).idxmin()
plt.plot(x[1:])
plt.plot(
dfg.get_group(mingr).value
);
plt.title(
"position from {} to {}".format(
dfg.get_group(mingr).index[0],
dfg.get_group(mingr).index[-1]));
这是如何运作的
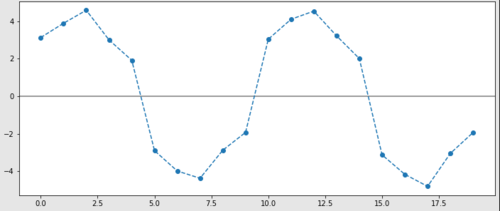
我创建了一个更容易遵循的数据集
x = np.array([3,4,4.5,3,2])
X = np.r_[x,-x,x,-x]+np.random.normal(0,.2,20)
plt.figure(figsize=(12,5))
plt.axhline(0, color='gray')
plt.plot(X, 'o--');
我想知道具有连续负值或正值的序列。这可以使用过滤器 X < 0 进行存档。
df = pd.DataFrame({'value': X, 'lt_zero': X < 0})
df[:10]
value lt_zero
0 3.125986 False
1 3.885588 False
2 4.580410 False
3 2.998920 False
4 1.913088 False
5 -2.902447 True
6 -3.986654 True
7 -4.373026 True
8 -2.878661 True
9 -1.929964 True
现在,当我比较每个连续值时,我可以找到符号发生变化的索引。我在数据之前连接一个 False,以免丢失第一个值。
df['sign_switch'] = np.diff(np.r_[False, X < 0])
df[:10]
value lt_zero sign_switch
0 3.125986 False False
1 3.885588 False False
2 4.580410 False False
3 2.998920 False False
4 1.913088 False False
5 -2.902447 True True
6 -3.986654 True False
7 -4.373026 True False
8 -2.878661 True False
9 -1.929964 True False
我为cumsum()每个序列得到一个递增的整数值。现在我为每个序列都有一个分组变量。
df['sign_sequence'] = np.diff(np.r_[False, X < 0]).cumsum()
df[:10]
value lt_zero sign_switch sign_sequence
0 3.125986 False False 0
1 3.885588 False False 0
2 4.580410 False False 0
3 2.998920 False False 0
4 1.913088 False False 0
5 -2.902447 True True 1
6 -3.986654 True False 1
7 -4.373026 True False 1
8 -2.878661 True False 1
9 -1.929964 True False 1
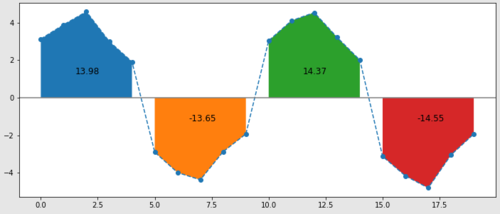
对于每个组,我可以计算组中值的积分。
sign_groups = df.groupby('sign_sequence')
sign_groups.apply(lambda x: np.trapz(x.value))
sign_sequence
0 13.984455
1 -13.654547
2 14.370044
3 -14.549090
您可以稍后访问每个组并使用这些区域。例如绘制区域。
plt.figure(figsize=(12,5))
plt.plot(X,'o--')
plt.axhline(0, c='gray')
for e,group in enumerate(sign_groups):
plt.fill_between(group[1].index,0, group[1].value)
area = np.trapz(group[1].value)
plt.text((e)*5+1.5, np.sign(area) * 1.25, f'{area:.2f}', fontsize=12)
添加回答
举报
0/150
提交
取消