4 回答
TA贡献1873条经验 获得超9个赞
用于*y将所有列数据(x 列之后)存储在 y 变量中。delimite=' '如果您的数据是空格分隔的,请使用。
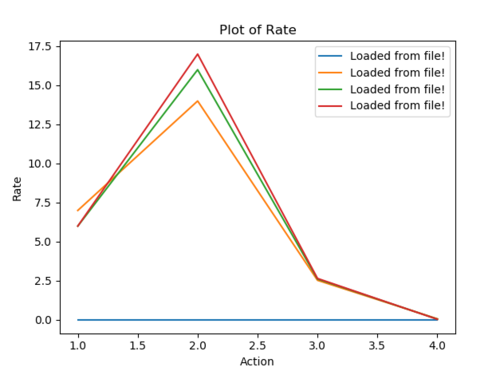
因此,只需在加载文件时进行此更正并保留其他代码即可): x, *y = np.loadtxt(file_name, delimiter=',', unpack=True)
结果:

TA贡献1877条经验 获得超6个赞
用于
pandas.read_csv读入文件,并将第0列设置为索引根据所示示例使用
sep='\\s+',但如果它不是 OP 中的内容,请使用适当的分隔符。根据示例,使用
header=None,但根据文件需要进行更改。
用于
pandas.DataFrame.plot在 1 行中绘制数据框。此外,使用的好处
pandas是现在可以轻松分析数据。尝试df.describe()获取按列的统计数据。
import pandas as pd
# read the file
df = pd.read_csv('file.txt', sep='\\s+', header=None, index_col=0)
# add column names if desired; the list must have as many values as there are columns
df.columns = ['a', 'b', 'c', 'd']
# plot the data
df.plot(figsize=(7, 4), xlabel='Action', ylabel='Rate', title='Plot of Rate')

数据汇总统计
df.describe()
a b c d
count 4.00000 4.000 4.00000 4.00000
mean 4.75000 11.750 1.94944 0.04006
std 3.20156 7.932 1.30055 0.02926
min 0.00000 0.000 0.00000 0.00000
25% 4.50000 10.500 1.90036 0.03021
50% 6.00000 15.000 2.57312 0.04554
75% 6.25000 16.250 2.62220 0.05539
max 7.00000 17.000 2.65154 0.06918
TA贡献1848条经验 获得超6个赞
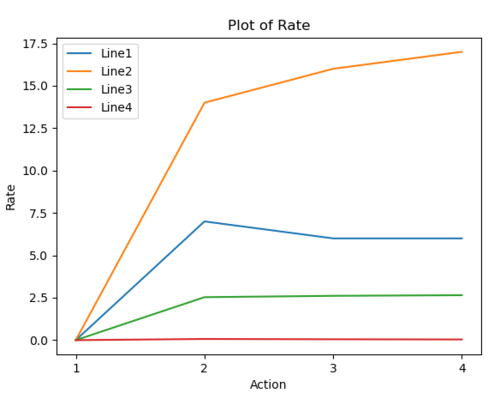
请检查片段

import matplotlib.pyplot as plt
import pandas as pd
import matplotlib.ticker as ticker
df = pd.read_csv('samp.txt', sep=" ", header=None)
df.columns = ["x", "y1", "y2", "y3","y4"]
print(df)
fig, ax = plt.subplots()
ax.plot(df['x'],df['y1'], label='Line1')
ax.plot(df['x'],df['y2'], label='Line2')
ax.plot(df['x'],df['y3'], label='Line3')
ax.plot(df['x'],df['y4'], label='Line4')
tick_spacing = 1
ax.xaxis.set_major_locator(ticker.MultipleLocator(tick_spacing))
plt.xlabel('Action')
plt.ylabel('Rate')
plt.title('Plot of Rate')
plt.legend()
plt.show()
TA贡献1911条经验 获得超7个赞
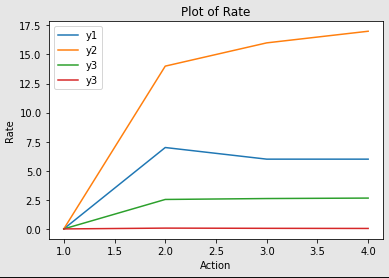
所以首先我将数据加载到 4 个变量中,其中一个是 x,其中三个是 y1、y2、y3,然后我只使用该方法三次以创建'plot'三个不同的图形
import matplotlib.pyplot as plt
import numpy as np
file_name = input("Enter the file name:")
data = np.loadtxt(file_name, delimiter=',', unpack=True)
x = data[0]
y1 = data[1] # the first graph
y2 = data[2] # the second graph
y3 = data[3] # the third graph
y4 = data[4] # the fourth graph
plt.plot(x,y1, label='y1')
plt.plot(x,y2, label='y2')
plt.plot(x,y3, label='y3')
plt.plot(x,y4, label='y3')
plt.xlabel('Action')
plt.ylabel('Rate')
plt.title('Plot of Rate')
plt.legend()
plt.show()

添加回答
举报
