1 回答
TA贡献1735条经验 获得超5个赞
回答
首先,您必须包含所需的库:
import matplotlib.pyplot as plt
from mpl_toolkits.axes_grid1 import host_subplot
import mpl_toolkits.axisartist as AA
然后你可以生成第一个轴
ax = host_subplot(111, axes_class = AA.Axes, figure = fig)
然后通过生成次轴
ax2=ax.twiny()
此时,您需要为次轴腾出一些空间,因此您应该使用以下命令抬高绘图区域的底部
plt.subplots_adjust(bottom = 0.2)
最后将次轴定位在第一个轴下方
offset = -40
new_fixed_axis = ax2.get_grid_helper().new_fixed_axis
ax2.axis['bottom'] = new_fixed_axis(loc = 'bottom',
axes = ax2,
offset = (0, offset))
ax2.axis['bottom'].toggle(all = True)
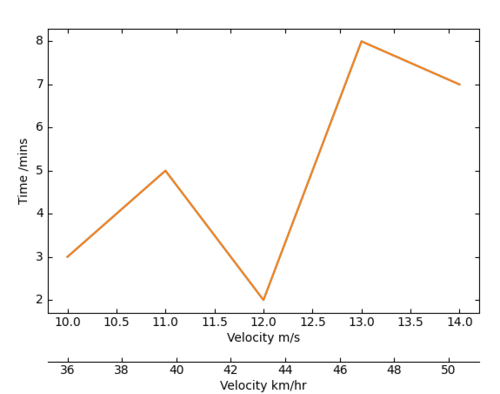
完整代码
import matplotlib.pyplot as plt
from mpl_toolkits.axes_grid1 import host_subplot
import mpl_toolkits.axisartist as AA
y = [3, 5, 2, 8, 7]
x = [[10, 11, 12, 13, 14], [36, 39.6, 43.2, 46.8, 50.4]]
labels = ['m/s', 'km/hr']
fig = plt.figure()
# generate the first axis
ax = host_subplot(111, axes_class = AA.Axes, figure = fig)
ax.plot(x[0], y)
ax.set_xlabel("Velocity m/s")
ax.set_ylabel("Time /mins")
ax2=ax.twiny()
# make space for the secondary axis
plt.subplots_adjust(bottom = 0.2)
# set position ax2 axis
offset = -40
new_fixed_axis = ax2.get_grid_helper().new_fixed_axis
ax2.axis['bottom'] = new_fixed_axis(loc = 'bottom',
axes = ax2,
offset = (0, offset))
ax2.axis['bottom'].toggle(all = True)
ax2.plot(x[1], y)
ax2.set_xlabel("Velocity km/hr")
plt.show()
结果

添加回答
举报
