3 回答
TA贡献1817条经验 获得超14个赞
你可以用这个把戏
library(gridExtra)
library(grid)
element_custom <- function() {
structure(list(), class = c("element_custom", "element_text"))
}
element_grob.element_custom <- function(element, label="", ...) {
mytheme <- ttheme_minimal(core = list(fg_params = list(parse=TRUE,
hjust=0, x=0.1)))
disect <- strsplit(label, "\\n")[[1]]
tableGrob(as.matrix(disect), theme=mytheme)
}
# default method is unreliable
heightDetails.gtable <- function(x) sum(x$heights)
ggplot(iris, aes(Sepal.Length, Sepal.Width)) +
geom_line() +
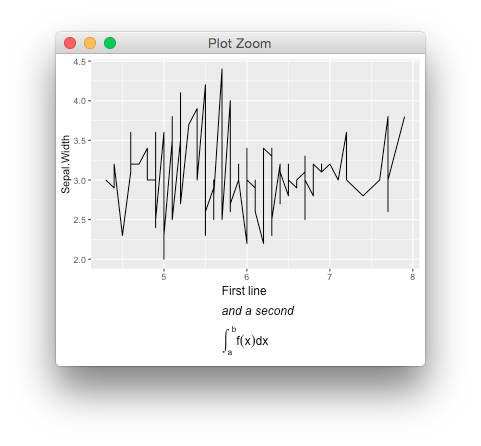
labs(x= "First~line \n italic('and a second') \n integral(f(x)*dx, a, b)")+
(theme_grey() %+replace% theme(axis.title.x = element_custom()))

- 3 回答
- 0 关注
- 1619 浏览
添加回答
举报
