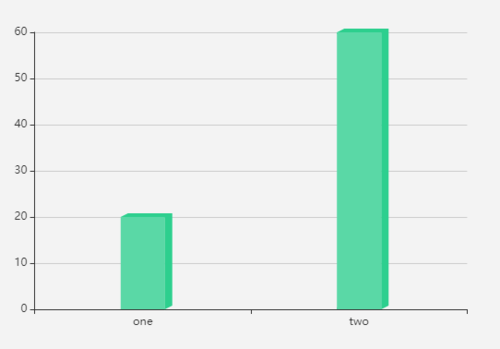
这样的坐标是2d的,图型是3d的统计图用的是用的那种插件,希望大神能提供个思路,我知道的echarts和highcharts、chart.js好像做不出来(或者给柱子上个背景?)
4 回答
温迪me
TA贡献2条经验 获得超4个赞
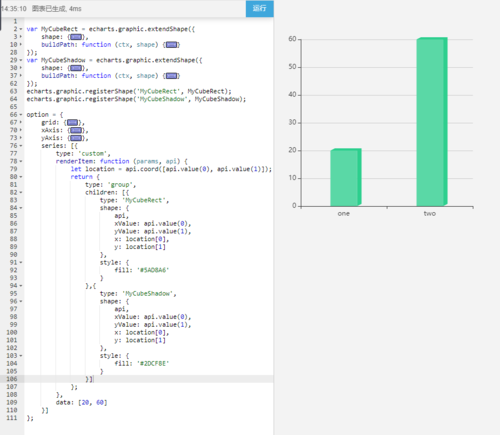
custom组合型:
var MyCubeRect = echarts.graphic.extendShape({
    shape: {
        x: 0,
        y: 0,
        width: 48, //柱宽
        zWidth: 8, //阴影折角宽
        zHeight: 4, //阴影折角高
    },
    buildPath: function (ctx, shape) {
        const api = shape.api;
        const xAxisPoint = api.coord([shape.xValue, 0]);
        const p0 = [shape.x, shape.y];
        const p1 = [shape.x - 24, shape.y];
        const p4 = [shape.x + 24, shape.y];
        const p2 = [xAxisPoint[0] - 24, xAxisPoint[1]];
        const p3 = [xAxisPoint[0] + 24, xAxisPoint[1]];

        ctx.moveTo(p0[0], p0[1]); //0
        ctx.lineTo(p1[0], p1[1]); //1
        ctx.lineTo(p2[0], p2[1]); //2
        ctx.lineTo(p3[0], p3[1]); //3
        ctx.lineTo(p4[0], p4[1]); //4
        ctx.lineTo(p0[0], p0[1]); //0
        ctx.closePath();
    }
});
var MyCubeShadow = echarts.graphic.extendShape({
    shape: {
        x: 0,
        y: 0,
        width: 48,
        zWidth: 8,
        zHeight: 4,
    },
    buildPath: function (ctx, shape) {
        const api = shape.api;
        const xAxisPoint = api.coord([shape.xValue, 0]);
        const p0 = [shape.x, shape.y];
        const p1 = [shape.x - 24, shape.y];
        const p4 = [shape.x + 24, shape.y];
        const p6 = [shape.x + 24 + 8, shape.y - 4];
        const p7 = [shape.x - 24 + 8, shape.y - 4];
        const p3 = [xAxisPoint[0] + 24, xAxisPoint[1]];
        const p5 = [xAxisPoint[0] + 24 + 8, xAxisPoint[1] - 4];

        ctx.moveTo(p4[0], p4[1]); //4
        ctx.lineTo(p3[0], p3[1]); //3
        ctx.lineTo(p5[0], p5[1]); //5
        ctx.lineTo(p6[0], p6[1]); //6
        ctx.lineTo(p4[0], p4[1]); //4

        ctx.moveTo(p4[0], p4[1]); //4
        ctx.lineTo(p6[0], p6[1]); //6
        ctx.lineTo(p7[0], p7[1]); //7
        ctx.lineTo(p1[0], p1[1]); //1
        ctx.lineTo(p4[0], p4[1]); //4
        ctx.closePath();
    }
});
echarts.graphic.registerShape('MyCubeRect', MyCubeRect);
echarts.graphic.registerShape('MyCubeShadow', MyCubeShadow);
option = {
    grid: {
        height: 300
    },
    xAxis: {
        data: ['one', 'two']
    },
    yAxis: {
        type: 'value'
    },
    series: [{
        type: 'custom',
        renderItem: function (params, api) {
            let location = api.coord([api.value(0), api.value(1)]);
            return {
                type: 'group',
                children: [{
                    type: 'MyCubeRect',
                    shape: {
                        api,
                        xValue: api.value(0),
                        yValue: api.value(1),
                        x: location[0],
                        y: location[1]
                    },
                    style: {
                        fill: '#5AD8A6'
                    }
                },{
                    type: 'MyCubeShadow',
                    shape: {
                        api,
                        xValue: api.value(0),
                        yValue: api.value(1),
                        x: location[0],
                        y: location[1]
                    },
                    style: {
                        fill: '#2DCF8E'
                    }
                }]
            };
        },
        data: [20, 60]
    }]
};

温迪me
TA贡献2条经验 获得超4个赞
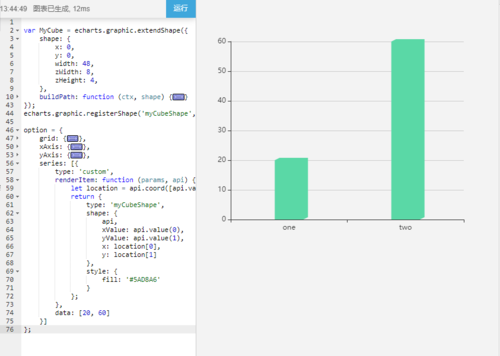
// custom
var MyCube = echarts.graphic.extendShape({
shape: {
x: 0,
y: 0,
width: 48, //柱宽
zWidth: 8, //阴影折角宽
zHeight: 4, //阴影折角高
},
buildPath: function (ctx, shape) {
 const api = shape.api;
 const xAxisPoint = api.coord([shape.xValue, 0]);
 const p0 = [shape.x, shape.y];
 const p1 = [shape.x - 24, shape.y];
 const p4 = [shape.x + 24, shape.y];
 const p6 = [shape.x + 24 + 8, shape.y - 4];
 const p7 = [shape.x - 24 + 8, shape.y - 4];
 const p2 = [xAxisPoint[0] - 24, xAxisPoint[1]];
 const p3 = [xAxisPoint[0] + 24, xAxisPoint[1]];
 const p5 = [xAxisPoint[0] + 24 + 8, xAxisPoint[1] - 4];

 ctx.moveTo(p0[0], p0[1]); //0
 ctx.lineTo(p1[0], p1[1]); //1
 ctx.lineTo(p2[0], p2[1]); //2
 ctx.lineTo(p3[0], p3[1]); //3
 ctx.lineTo(p4[0], p4[1]); //4
 ctx.lineTo(p0[0], p0[1]); //0
 ctx.moveTo(p4[0], p4[1]); //4
 ctx.lineTo(p3[0], p3[1]); //3
 ctx.lineTo(p5[0], p5[1]); //5
 ctx.lineTo(p6[0], p6[1]); //6
 ctx.lineTo(p4[0], p4[1]); //4
 ctx.moveTo(p4[0], p4[1]); //4
 ctx.lineTo(p6[0], p6[1]); //6
 ctx.lineTo(p7[0], p7[1]); //7
 ctx.lineTo(p1[0], p1[1]); //1
 ctx.lineTo(p4[0], p4[1]); //4
 ctx.closePath();;    }});
 echarts.graphic.registerShape('myCubeShape', MyCube);
 option = {
 grid: {
   height: 300
 },
 xAxis: {
   data: ['one', 'two']
 },
 yAxis: {
   type: 'value'
 },
 series: [{
   type: 'custom',
   renderItem: function (params, api) {
    let location = api.coord([api.value(0), api.value(1)]);
        return {
          type: 'myCubeShape',
         shape: {
           api,
           xValue: api.value(0),
           yValue: api.value(1),
           x: location[0],
           y: location[1]

              },
            style: {
            fill: '#5AD8A6'
            }
         };
   },
  data: [20, 60]
 }
]};
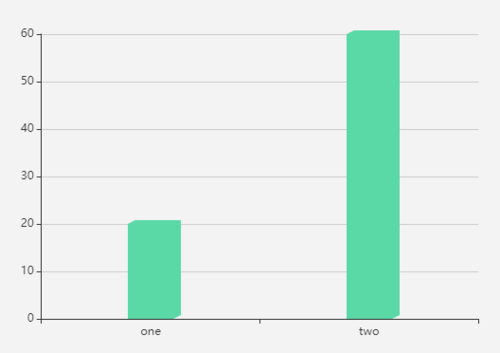
展示效果:


添加回答
举报
0/150
提交
取消


