一、基本概念
众所周知,在求最优解时常用到两个方法,两者均可用于线性/非线性拟合:
最小二乘法
该方法直接对代价函数求导,目的找出全剧最小,非迭代法梯度下降法
先给定一个theta,然后向梯度反方向不断调整,若干次迭代后找到cost function的局部最小值。
梯度下降算法主要包括两个部分:
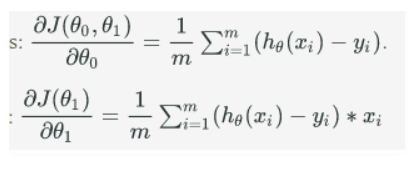
计算梯度:
调整权值直至cost function收敛(两次相邻cost的差小于我们设定的阈值)
由偏导可以看出,当预测值h(x)和实际值yi相等时,偏导为0,此时无需调整权值。
`
二、接下来实现梯度下降算法,并对实际数据集进行建模预测
数据集下载地址:https://github.com/huangtaosdt/Gradient-Descent-Algorithm/tree/master/data
1)探索数据
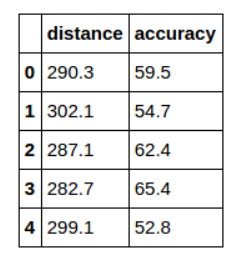
首先对数据进行预处理:
import pandas as pd

pga=pd.read_csv('./data/pga.csv')
pga.head()
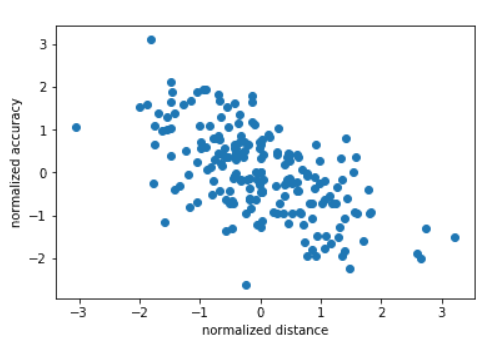
规范化数据,并绘制散点图:
# Data preprocessing# Normalize the datapga['distance']=(pga['distance']-pga['distance'].mean())/pga['distance'].std()
pga['accuracy']=(pga['accuracy']-pga['accuracy'].mean())/pga['accuracy'].std()

%matplotlib inlineimport matplotlib.pyplot as plt

plt.scatter(pga['distance'],pga['accuracy'])
plt.xlabel('normalized distance')
plt.ylabel('normalized accuracy')
plt.show()
既然我们想通过梯度下降法求得可以时模型误差最小的theta值,那么我们可以先使用sklearn训练模型并查看sklearn中使用的最优theta值是多少,从而验证没我们自己写的算法所求得的theta是否正确:
lr=LinearRegression()
lr.fit(pga.distance[:,np.newaxis],pga['accuracy'])  # Another way is using pga[['distance']]theta0=lr.intercept_
theta1=lr.coef_print(theta0)print(theta1)
得:
-4.49711161658e-17
[-0.60759882]
注意:sklearn中的LinearRegression使用的最优最算并非梯度下降,而是根据训练数据是否为系数矩阵等去使用不同的算法。
2)接下来实现梯度下降算法,先给出伪代码:
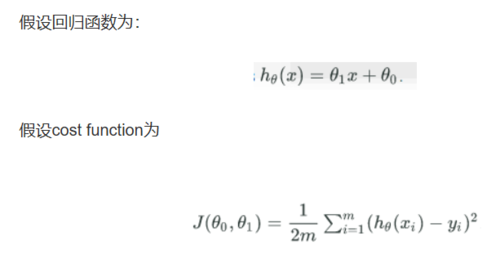
计算误差(平均总误差)
调整theta0、 1
向梯度反方向调整
重新计算cost
计算误差 cost function
#calculating cost-function for each theta1#计算平均累积误差def cost(x,y,theta0,theta1):
    J=0
    for i in range(len(x)):
        mse=(x[i]*theta1+theta0-y[i])**2
        J+=mse    return J/(2*len(x))
定义theta调整函数--利用梯度下降调整theta
def partial_cost_theta0(x,y,theta0,theta1):
    #y=theta1*x + theta0,线性回归;而非非线性中的sigmoid函数
    #对x series求整体误差,再求其均值
    h=theta1*x+theta0
    diff=(h-y)
    partial=diff.sum()/len(diff)    return partialdef partial_cost_theta1(x,y,theta0,theta1):
    diff=(h-y)*x
    partial=diff.sum()/len(diff)    return partial
具体过程:
def gradient_descent(x,y,alpha=0.1,theta0=0,theta1=0):  #设置默认参数
    #计算成本
    #调整权值
    #计算错误代价,判断是否收敛或者达到最大迭代次数
    most_iterations=1000
    convergence_thres=0.000001
    c=cost(x,y,theta0,theta1)
    costs=[c]
    cost_pre=c+convergence_thres+1.0
    counter=0

    while( (np.abs(c-cost_pre)>convergence_thres) & (counter<most_iterations) ):

        update0=alpha*partial_cost_theta0(x,y,theta0,theta1)
        update1=alpha*partial_cost_theta1(x,y,theta0,theta1)

        theta0-=update0
        theta1-=update1

        cost_pre=c
        c=cost(x,y,theta0,theta1)
        costs.append(c)
        counter+=1
    return  {'theta0': theta0, 'theta1': theta1, "costs": costs}


print("Theta1 =", gradient_descent(pga.distance, pga.accuracy)['theta1'])
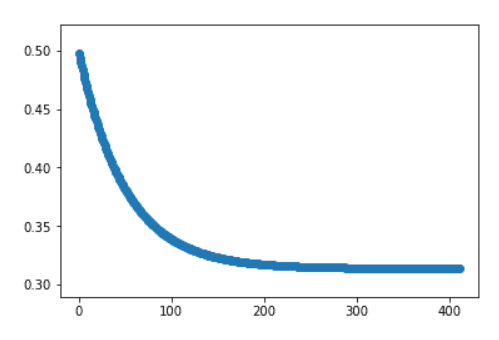
costs=gradient_descent(pga.distance,pga.accuracy,alpha=.01)['costs']
print(gradient_descent(pga.distance, pga.accuracy,alpha=.01)['theta1'])
plt.scatter(range(len(costs)),costs)
plt.show()
结果为:
Theta1 = -0.6046983166379608
-0.5976256382464712
由此可以看出,当学习率为0.1时,得出的结果跟使用sklearn中的linearRegression得出的theta值非常近似。
作者:asdfcxz
链接:https://www.jianshu.com/p/766b13c78249
共同学习,写下你的评论
评论加载中...
作者其他优质文章


