sas day 53:
A classical AE table is by SOC (body system class) and Preferred term( AEDECOD). The overall AE table could last for over 100 pages long.
What if we’d like to see the count and confidence Interval for some Special Interested Adverse Event (SIAE) within the whole safety population.
Challenge: How to generate an AE table with confidence Interval ?
Example:
Key point: Each adverse event as an EVENT in the total population. If there are 8 special adverse events then we need to create a dummy ADSL population 8 times, each set of ADSL patients for one adverse event.
Each Column run a Proc Freq (3 times, non-serious, serious, all event)
Key Procedure: Proc Freq, Binomial
Solution:
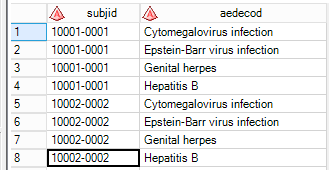
- Create a Dummy ADSL Dataset (Do … Output) for each AEDECOD term.
data adsl_adr(keep= subjid aedecod);
set adsl;
do i=1 to pobs;
set adr point=i nobs= pobs;
output;
end;
run;
- Proc Freq to Calculate Confidence Interval for Serious Event
data ci1;
merge adsl_adr(in=a) ser(in=b);
if a;
by subjid aedecod;
run;

proc freq data=ci1y;
by aedecod trt1;
tables aey/ binomial(exact)  alpha=0.05;
output out=ciy binomial;
run;

data ciyy;
set ciy;
sort=_n_;
c1= "("||strip(put(round((XL_BIN), 0.00001), best.))||", "||strip(put(round((XU_BIN), 0.00001), best.))||")";
label="   95% Confidence Interval";
keep label aedecod c1 ord2 sort;
run;
- Repeat Step 2 for Non-serious and All events.
Output:
Happy Studying!
点击查看更多内容
为 TA 点赞
评论
共同学习,写下你的评论
评论加载中...
作者其他优质文章
正在加载中
感谢您的支持,我会继续努力的~
扫码打赏,你说多少就多少
赞赏金额会直接到老师账户
支付方式
打开微信扫一扫,即可进行扫码打赏哦


