
代码是:
private RadarChart chart;
@Override
protected void onCreate(Bundle savedInstanceState) {
super.onCreate(savedInstanceState);
getWindow().setFlags(WindowManager.LayoutParams.FLAG_FULLSCREEN,
WindowManager.LayoutParams.FLAG_FULLSCREEN);
setContentView(R.layout.activity_radarchart);
setTitle("RadarChartActivity");
chart = (RadarChart)findViewById(R.id.chart1);
chart.setBackgroundColor(Color.rgb(60, 65, 82));
chart.getDescription().setEnabled(false);
chart.setWebLineWidth(1f);
chart.setWebColor(Color.LTGRAY);
chart.setWebLineWidthInner(1f);
chart.setWebColorInner(Color.LTGRAY);
chart.setWebAlpha(100);
// create a custom MarkerView (extend MarkerView) and specify the layout
// to use for it
MarkerView mv = new RadarMarkerView(this, R.layout.radar_markerview);
mv.setChartView(chart); // For bounds control
chart.setMarker(mv); // Set the marker to the chart
setData();
chart.animateXY(1400, 1400, Easing.EaseInOutQuad);
XAxis xAxis = chart.getXAxis();
xAxis.setTypeface(tfLight);
xAxis.setTextSize(9f);
xAxis.setYOffset(0f);
xAxis.setXOffset(0f);
xAxis.setValueFormatter(new IAxisValueFormatter() {
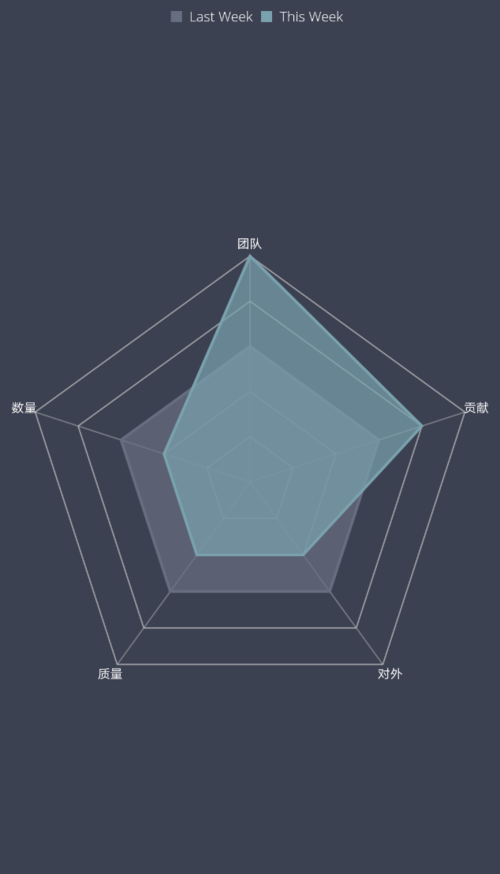
private final String[] mActivities = new String[]{"团队", "贡献", "对外", "质量", "数量"};
@Override
public String getFormattedValue(float value, AxisBase axisBase) {
return mActivities[(int) value % mActivities.length];
}
});
xAxis.setTextColor(Color.WHITE);
YAxis yAxis = chart.getYAxis();
yAxis.setTypeface(tfLight);
yAxis.setLabelCount(5, false);
yAxis.setTextSize(9f);
yAxis.setAxisMinimum(0f);
yAxis.setAxisMaximum(80f);
yAxis.setDrawLabels(false);
Legend l = chart.getLegend();
l.setVerticalAlignment(Legend.LegendVerticalAlignment.TOP);
l.setHorizontalAlignment(Legend.LegendHorizontalAlignment.CENTER);
l.setOrientation(Legend.LegendOrientation.HORIZONTAL);
l.setDrawInside(false);
l.setTypeface(tfLight);
l.setXEntrySpace(7f);
l.setYEntrySpace(5f);
l.setTextColor(Color.WHITE);
}
private void setData() {
float mul = 80;
float min = 20;
int cnt = 5;
ArrayList<RadarEntry> entries1 = new ArrayList<>();
ArrayList<RadarEntry> entries2 = new ArrayList<>();
// NOTE: The order of the entries when being added to the entries array determines their position around the center of
// the chart.
for (int i = 0; i < cnt; i++) {
entries1.add(new RadarEntry(60));
}
for (int i = 0; i < cnt; i++) {
if(i == 0) {
entries2.add(new RadarEntry(100));
}else if(i == 1) {
entries2.add(new RadarEntry(80));
}else{
entries2.add(new RadarEntry(40));
}
}
RadarDataSet set1 = new RadarDataSet(entries1, "Last Week");
set1.setColor(Color.rgb(103, 110, 129));
set1.setFillColor(Color.rgb(103, 110, 129));
set1.setDrawFilled(true);
set1.setFillAlpha(180);
set1.setLineWidth(2f);
set1.setDrawHighlightCircleEnabled(true);
set1.setDrawHighlightIndicators(false);
RadarDataSet set2 = new RadarDataSet(entries2, "This Week");
set2.setColor(Color.rgb(121, 162, 175));
set2.setFillColor(Color.rgb(121, 162, 175));
set2.setDrawFilled(true);
set2.setFillAlpha(180);
set2.setLineWidth(2f);
set2.setDrawHighlightCircleEnabled(true);
set2.setDrawHighlightIndicators(false);
ArrayList<IRadarDataSet> sets = new ArrayList<>();
sets.add(set1);
sets.add(set2);
RadarData data = new RadarData(sets);
data.setValueTypeface(tfLight);
data.setValueTextSize(8f);
data.setDrawValues(false);
data.setValueTextColor(Color.WHITE);
chart.setData(data);
chart.invalidate();
}数据源的添加部分是:
ArrayList<RadarEntry> entries1 = new ArrayList<>();
ArrayList<RadarEntry> entries2 = new ArrayList<>();

// NOTE: The order of the entries when being added to the entries array determines their position around the center of
// the chart.
for (int i = 0; i < cnt; i++) {
    entries1.add(new RadarEntry(60));
}

for (int i = 0; i < cnt; i++) {
    if(i == 0) {
        entries2.add(new RadarEntry(100));
    }else if(i == 1) {
        entries2.add(new RadarEntry(80));
    }else{
        entries2.add(new RadarEntry(40));
    }
}
点击查看更多内容
1人点赞
评论
共同学习,写下你的评论
评论加载中...
作者其他优质文章
正在加载中


感谢您的支持,我会继续努力的~
扫码打赏,你说多少就多少
赞赏金额会直接到老师账户
支付方式
打开微信扫一扫,即可进行扫码打赏哦