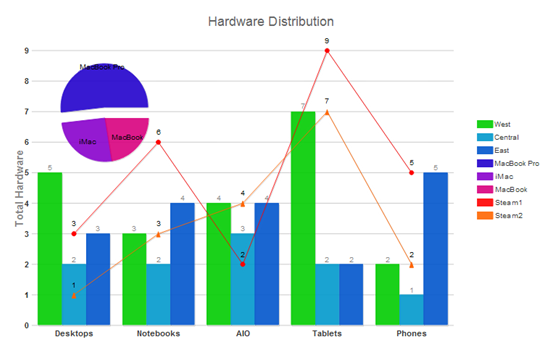
Wijmo的CompositeChart控件允许您使用一个Chart来分析和展现复杂的数据。相同的数据可以使用不同的可视化效果,不同的图表类型展现在一个图表内,使得用户可以从不同的角度,了解分析这组数据所表达的内容 。
本文将介绍如何使用Wijmo的CompositeChart控件,制作一个复合图表。CompositeChart 的API:http://wijmo.com/wiki/index.php/Compositechart,Wijmo 的CompositeChart 化繁为简,将传统 Excel like图表中的三大区域: Plot Area, Legend Area, Label Area, 分离成为更为简单的API: SeriesList, Legend, Axis, Hint, 使得开发者更加容易的理解和使用。
Wijmo的CompositeChart 依赖于下面的这5个核心的JavaScript库:
raphael.js
globalize.min.js
jquery.ui.widget.js
jquery.wijmo.raphael.js
jquery.wijmo.wijchartcore.js
如果需要加入别的类型的Chart,需要再引入其它Chart类型的JavaScript库,这样可以使得开发者可以灵活定制并裁剪出适合自己用例的JavaScript库。例如本实例使用了 PieChart, BarChart, LineChart, 引入的JavaScript库如下:
jquery-1.7.1.min.js
jquery-ui-1.8.18.custom.min.js
globalize.min.js
raphael-min.js
jquery.wijmo.raphael.js
jquery.wijmo.wijchartcore.js
jquery.wijmo.wijbarchart.js
jquery.wijmo.wijpiechart.js
jquery.wijmo.wijlinechart.js
jquery.wijmo.wijcompositechart.js
写点代码,设置一下Chart :
$(document).ready(function () {$("#wijcompositechart").wijcompositechart({axis: {y: {text: "Total Hardware"},x: {text: ""}},stacked: false,hint: {content: function () {return this.label + '\n ' + this.y + '';}},header: {text: "Hardware Distribution"},seriesList: [{type: "column",label: "West",legendEntry: true,data: { x: ['Desktops', 'Notebooks', 'AIO', 'Tablets', 'Phones'], y: [5, 3, 4, 7, 2] }}, {type: "column",label: "Central",legendEntry: true,data: { x: ['Desktops', 'Notebooks', 'AIO', 'Tablets', 'Phones'], y: [2, 2, 3, 2, 1] }}, {type: "column",label: "East",legendEntry: true,data: { x: ['Desktops', 'Notebooks', 'AIO', 'Tablets', 'Phones'], y: [3, 4, 4, 2, 5] }}, {type: "pie",label: "asdfdsfdsf",legendEntry: true,center: { x: 150, y: 150 },radius: 60,data: [{label: "MacBook Pro",legendEntry: true,data: 46.78,offset: 15}, {label: "iMac",legendEntry: true,data: 23.18,offset: 0}, {label: "MacBook",legendEntry: true,data: 20.25,offset: 0}]}, {type: "line",label: "Steam1",legendEntry: true,data: {x: ['Desktops', 'Notebooks', 'AIO', 'Tablets', 'Phones'],y: [3, 6, 2, 9, 5]},markers: {visible: true,type: "circle"}}, {type: "line",label: "Steam2",legendEntry: true,data: {x: ['Desktops', 'Notebooks', 'AIO', 'Tablets', 'Phones'],y: [1, 3, 4, 7, 2]},markers: {visible: true,type: "tri"}}]});});
代码不多,就有了下图的效果:
代码不多,很好分析:
--axis: {y: {text: "Total Hardware"},x: {text: ""}--设置X,Y 轴。---stacked: false---设置Bar 为非stacked.---hint: {content: function () {return this.label + '\n ' + this.y + '';}},---设置鼠标 Tooltip.---header: {text: "Hardware Distribution"},---设置图表头.----seriesList: [{type: "column",label: "West",legendEntry: true,data: { x: ['Desktops', 'Notebooks', 'AIO', 'Tablets', 'Phones'], y: [5, 3, 4, 7, 2] }}, {type: "column",label: "Central",legendEntry: true,data: { x: ['Desktops', 'Notebooks', 'AIO', 'Tablets', 'Phones'], y: [2, 2, 3, 2, 1] }}, {type: "column",label: "East",legendEntry: true,data: { x: ['Desktops', 'Notebooks', 'AIO', 'Tablets', 'Phones'], y: [3, 4, 4, 2, 5] }}, {type: "pie",label: "asdfdsfdsf",legendEntry: true,center: { x: 150, y: 150 },radius: 60,data: [{label: "MacBook Pro",legendEntry: true,data: 46.78,offset: 15}, {label: "iMac",legendEntry: true,data: 23.18,offset: 0}, {label: "MacBook",legendEntry: true,data: 20.25,offset: 0}]}, {type: "line",label: "Steam1",legendEntry: true,data: {x: ['Desktops', 'Notebooks', 'AIO', 'Tablets', 'Phones'],y: [3, 6, 2, 9, 5]},markers: {visible: true,type: "circle"}}, {type: "line",label: "Steam2",legendEntry: true,data: {x: ['Desktops', 'Notebooks', 'AIO', 'Tablets', 'Phones'],y: [1, 3, 4, 7, 2]},markers: {visible: true,type: "tri"}}]
----
设置 SeriesList,每个Series 可以设置其type, label, legendEntry, data, 等等属性。 Series可以设置 SeriesStyles, 和 SeriesHoverStyles, 如:
seriesStyles: [{fill: "#8ede43", stroke: "#7fc73c", opacity: 0.8}],seriesHoverStyles: [{"stroke-width": "1.5", opacity: 1}]
经过上面的设置,这个CompositeChart就设置好了。也可以使用Server返回的 Json 数据动态绑定生成Chart。
共同学习,写下你的评论
评论加载中...
作者其他优质文章


